
Overview
What the Overview shows, from Live now and today's figures to the P&L Calendar, the charts of what you copied and the Live tab.
The Overview is the first page you see after you sign in. It answers three questions at a glance: what is copying right now, how today went, and how your copying has gone over the past weeks and months. It shows one Market Environment at a time, so switch between Forex and Futures at the top of the sidebar to see the other.
Live now
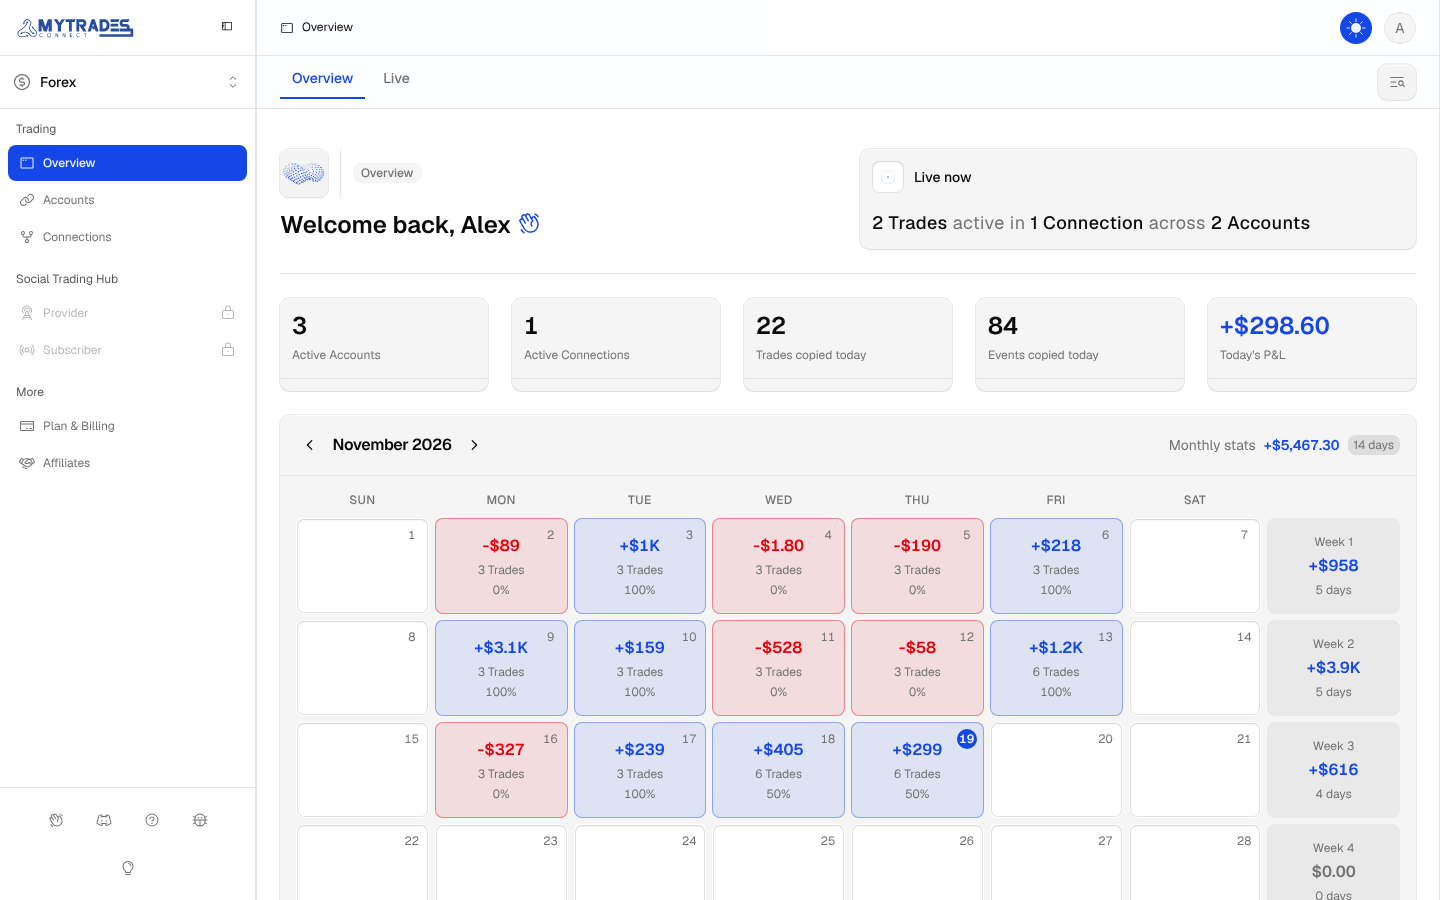
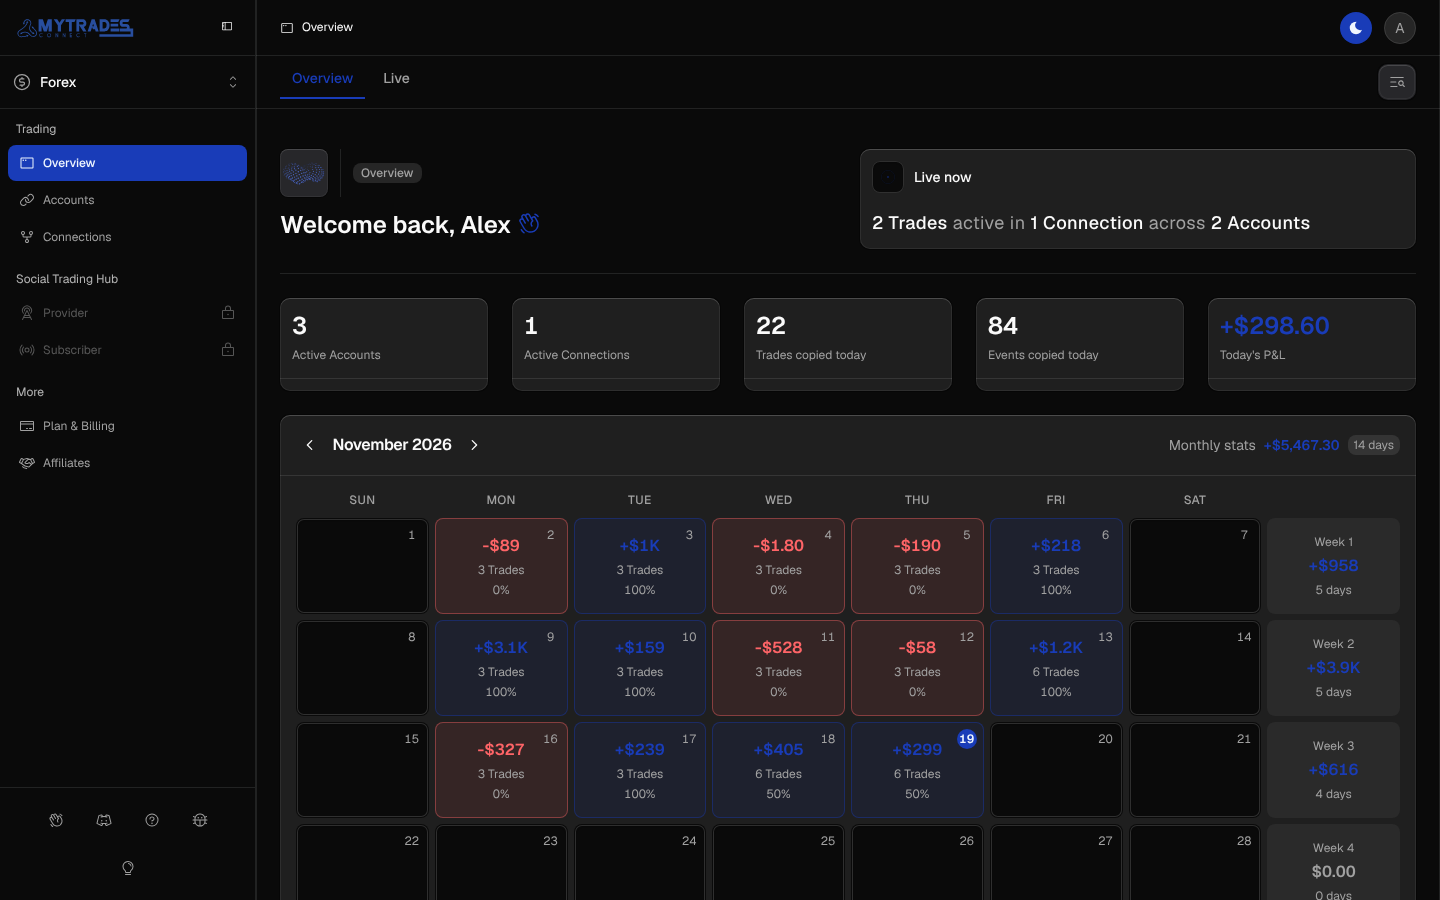
The Live now callout reads like a sentence: "2 Trades active in 1 Connection across 2 Accounts". It counts only copies that are open right now, so it drops to zero once every copied Trade has closed.
Each bold part opens a drawer:
- Trades: every open Trade, with its symbol, size, Connection and the steps copied so far, then each Receiver's status and P&L.
- Connections: the Connections those Trades run in.
- Accounts: the Receivers holding them.
Select an entry in a drawer to open it. The Accounts and Connections pages and each Account and Connection page carry the same callout, counted for that page only.
Today's figures
Five figures sit under the callout. Each counts the current New York day, so they start again at midnight New York time.
- Active Accounts: Masters and Receivers that copied at least once today.
- Active Connections: Connections that copied at least once today.
- Trades copied today: the Master's Trades that reached at least one Receiver today.
- Events copied today: every step copied today, such as an open, a partial close, a Stop Loss move or a close. One Trade copied to two Receivers counts its open twice.
- Today's P&L: the Realized P&L of the Trades your Connections closed today, one figure per currency. Trades and P&L explains where the figure comes from.
P&L Calendar
The P&L Calendar under today's figures shows a month of your realized P&L. Each day with closed Trades shows the Realized P&L of the Trades closed that New York day, how many closed and the share that won, tinted by your P&L colors. A Trade that ended even counts as no win.
- The column on the right totals each week: its P&L and the days you traded.
- Monthly stats in the header adds up the whole month and its traded days.
- The arrows step a month back or forward, and This month comes back to the current month.
- Select a day to open the Trades that closed on it, newest first, with their Account, side, size, P&L and when they opened and closed.
- When your Accounts hold more than one currency, Currency picks which one the calendar shows. P&L is never converted between currencies.
- On a phone each day shows only its P&L. Tap it to see the rest.
Past days stay in the calendar after you pause or delete a Connection. Each Account and Connection page carries its own P&L Calendar, counted for that page only.
Charts
Three charts sit below the P&L Calendar, over every Connection in this Market Environment. The Events chart and the Activity calendar count copies by the New York day of the Master's step, and count each Master step once, however many Receivers copied it, so today's bar can read lower than Events copied today, which counts every Receiver's copy.
- Events copied in 30 days: one bar per day for the steps copied, and a line for the Master's Trades they belong to. The headline reads Trades over Events, where a Trade that ran over several days counts once, the busiest day is named beside it, and the badge compares the 30 days with the 30 before them.
- Volume by Connection and Volume by Receiver: the size your Connections opened on Receivers over the last 30 days, in lots for Forex and contracts for Futures, for your six largest of each, under the total of them all. Only entries count, so a close or a partial close adds nothing.
- Activity: a calendar of the last 52 weeks, one square per day, darker on busier days. Hover a square to read its Trades over Events.
A copy counts once it has gone through on the Receiver, so a failed or skipped copy never shows. A deleted Connection leaves the charts with its copies, while its past days stay in the P&L Calendar.
Live
The Live tab at the top of the Overview shows every open Trade as a strip on one canvas, newest first. Each strip starts with the Trade's number, symbol, side and size, and the Master's name, which opens that Account's page.
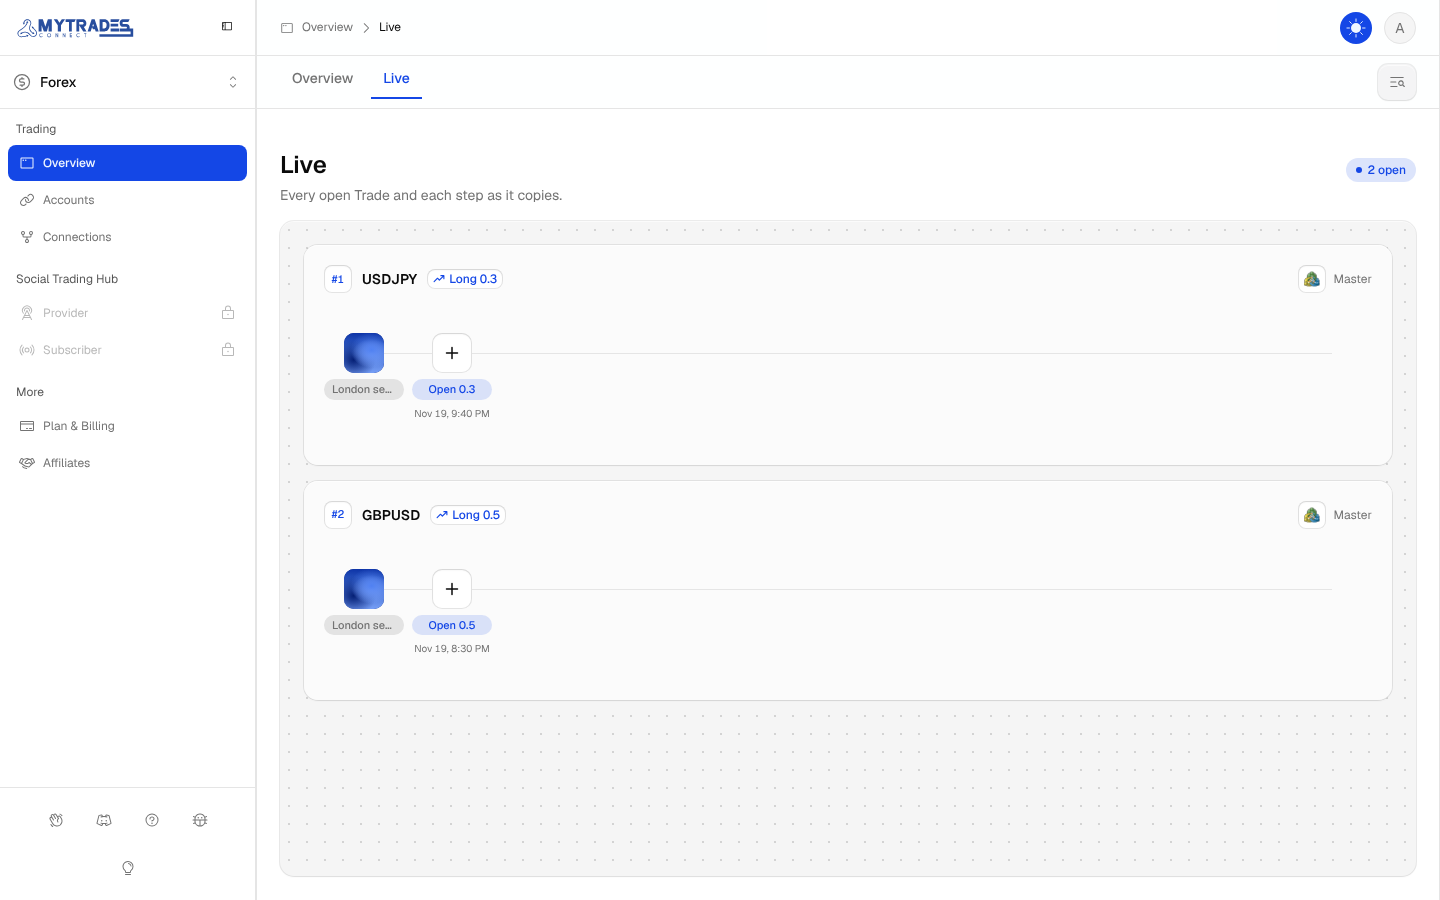
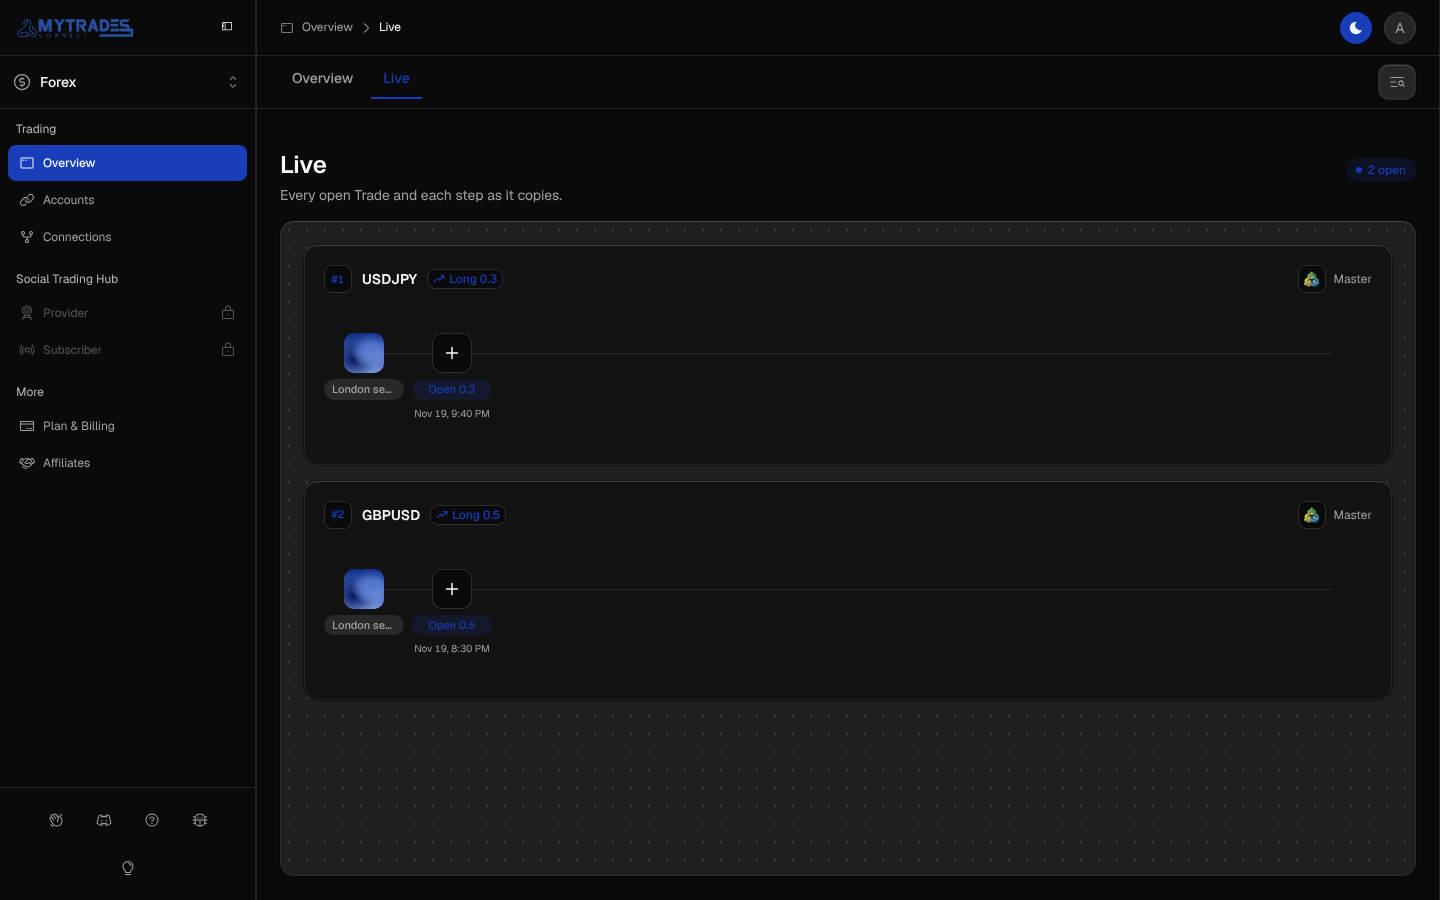
Below it, a line of tiles follows the Trade from left to right:
- The first tile is the Connection the Trade runs in. Select it to see how many Receivers hold a copy.
- Each next tile is one step copied so far, such as the open, a size change or a Stop Loss move, with its date and time. Select a step to see how each Receiver copied that step, and its P&L.
Each step has its own color, from how that step copied: gray with a spinner while a copy is still on its way, the app's main color when every Receiver copied it, amber when a Receiver copied it in part and red when a copy failed. New steps pop in as they arrive, since the canvas updates on its own every few seconds. When a Trade closes, its strip stays about a minute with its close as the last step, then leaves.
Live Trades
The Live Trades widget at the top right of every page, beside the light and dark switch, lists every open Trade the Live tab shows. Each row shows the Trade's newest step, such as an open or a Stop Loss move, its number, symbol and Connection, and each Receiver's status, with a spinner while a copy is still on its way. When a Trade closes, its close shows at the top for a few seconds after the last copy lands. The widget folds away while no Trade is open.
The widget is off until you turn it on in Settings, under Appearance. On a phone, it is hidden to keep the top bar clear.
Where to go next
- Accounts and their pages: every Account in one table, and a page for each.
- Connections and their pages: every Connection in one table, and a page for each.
- Trades and P&L: what each Receiver did with a Trade, and what it earned.
- Around the app: your profile, What's New, the welcome tour and the sidebar.